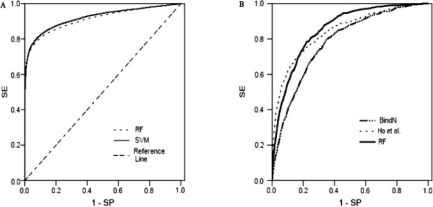
Fig. 2.
Performance comparisons of ROC graphs with other methods. (A) Both classifiers were preformed on the same dataset DBP-374 with the same features ‘PSSMS+SS+OBVS’. RF: performance from the features (A+B+C) of Table 2; SVM: a SVM-based method evaluated by nested cross-validation. (B) all classifiers were tested on the same testing dataset TS75. The predictors have the following AUC value: BindN 0.782, Ho et al. 0.843 and our RF model 0.855.

