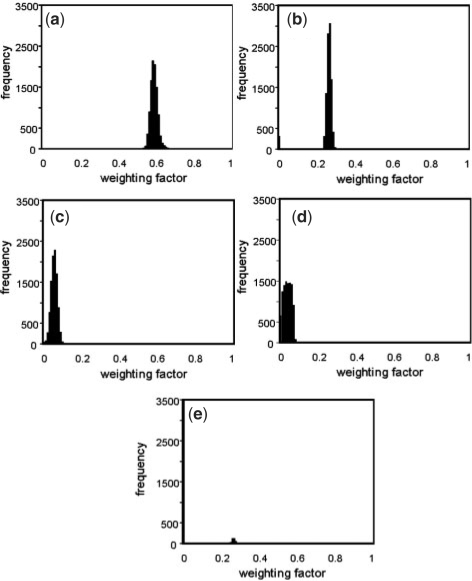
Fig. 3.
Perturbation analysis of non-negative least squares weighting factors. The sensitivity of the predicted weighting factors was tested using the batch growth data. Each measured flux was randomly perturbed independently within the experimental confidence range. Least squares analysis was then performed using the perturbed fluxes and the ecologically competitive pathways. The analysis was repeated 10 000 times. The weighting coefficients are plotted as a histogram. (a) Primary oxygen stress pathway weighting factor, (b) optimal carbon yielding metabolism pathway weighting factor, (c) secondary oxygen stress pathway weighting factor and (d) first-order investment stress pathway weighting factor. Occasionally additional modes would be utilized during the least squares analyses. (e) Highlights the mode with the highest average value. The ordinate in (e) has been truncated for consistency with the other plots a–d.

