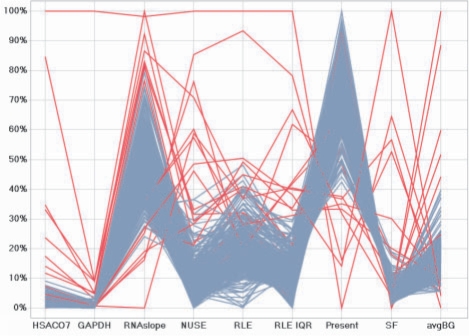
Fig. 2.
Parallel coordinate plots are a common way of visualizing multi-variate data with different scales to facilitate detection of outliers. Applying our QA approach, 18 of the 507 microarrays were flagged as aberrant (highlighted in red). As shown, our approach to QA has selected samples as problematic where one or more indicators appear as an outlier based on reduction of the dimensionality of the data via PCA and applying a sequential Wilks's multivariate outlier test at an α=0.01. Our approach provides greater consistency in designating problematic arrays through a statistical framework that does not rely on arbitrary cutoffs for any individual indicator.

