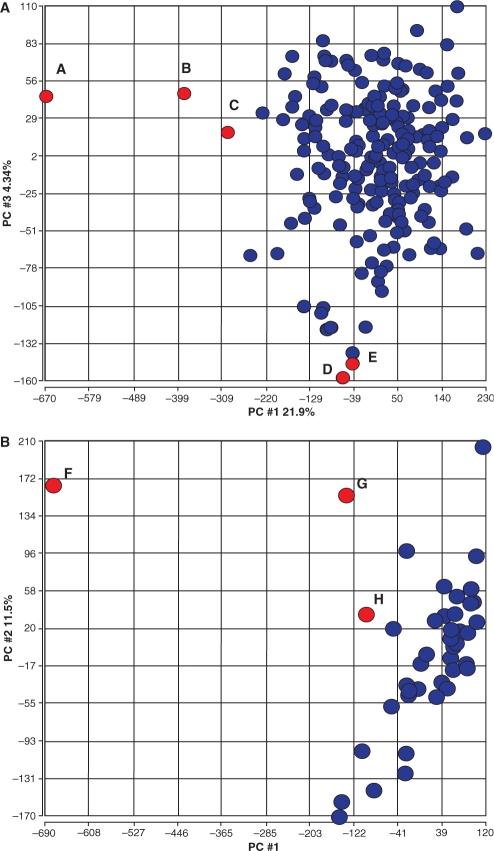
Fig. 3.
PCA was applied to gene expression estimates for all genes in two clinical trials. (A) The outlier detection approach described was applied to 204 arrays from a ragweed allergy study and identified five samples. These microarrays are highlighted in red in the PCA 1 versus PCA 3 plot for gene expression to show the relationship of outlier samples detected by the system to actual gene expression estimates per array. Points A, B and C have problematic NUSE values. Points D and E have abnormally high GAPDH and HSAC07 ratios. The location of these arrays based on gene expression PCA suggests that QA problems may contribute to deterioration of overall expression. (B) A kidney transplant trial with 42 arrays where three were detected as outliers. The three arrays are highlighted in red in the PCA 1 versus PCA 2 gene expression plot. Points F, G and H have abnormal NUSE, GAPDH and HSAC07 ratios. Again, the samples flagged by the QA approach appear to have gene expression estimates that differ from the majority of other arrays. The arrayMvout package includes a map fig3map from records in the ITN QA metrics matrix to samples labeled A–H in these figures.

