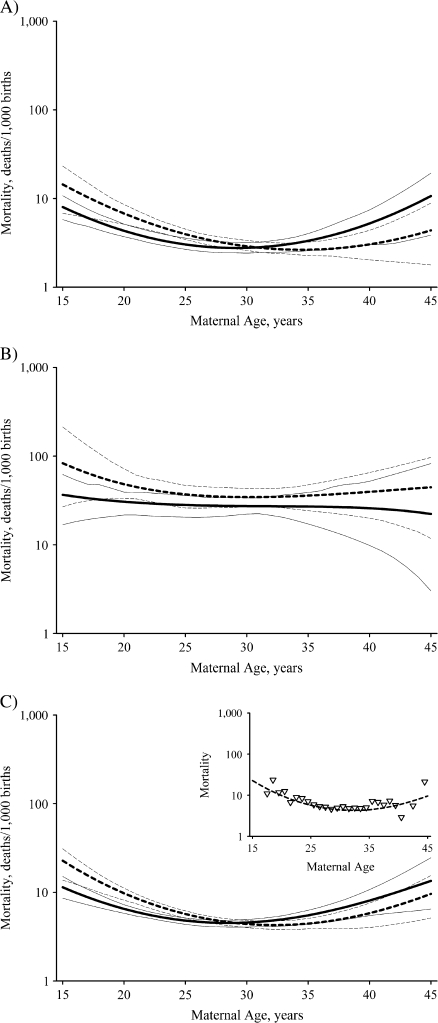
Figure 3.
Characteristic changes in infant mortality by maternal age, New York State, 1985–1988. A) primary subpopulation; B) secondary subpopulation; C) total infant mortality. The solid lines represent primiparous births (parity = 0), and the dashed lines represent multiparous births (parity = 1 or 2). The thin lines represent the respective bias-adjusted 95% confidence intervals. The results are for European-American males and are similar to the results for all populations examined, except as noted in the text. The insert in part C shows a comparison of the observed mortality rates (∇) with the model-estimated mortality rates for multiparous births.

