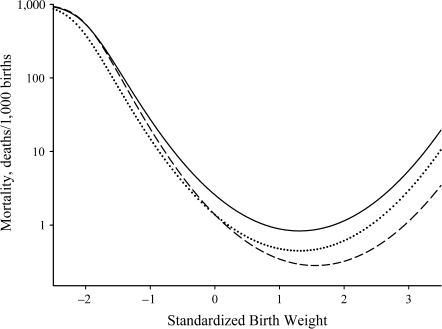
Figure 4.
Model-estimated birth-weight-specific infant mortality curves for secondary subpopulation European-American males born to multiparous mothers aged 20 years (solid line) and 25 years (dashed line), New York State, 1985–1988. The dotted line shows the mortality curve for mothers aged 25 years assuming “no indirect effect.”

