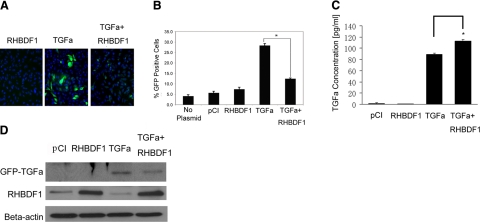
Figure 6.
RHBDF1 overexpression facilitates TGF-α release. A) Fluorescent images of HeLa cell cultures. Blue denotes cell nuclei; green denotes GFP-TGF-α. B) Percentage of GFP-positive cells in the cultures. C) ELISA analysis of TGF-α concentrations in the conditioned medium from the cultures. D) Western blot analysis of TGF-α protein levels in cells isolated from the cultures. RHBDF1, cells transfected with pCI/RHBDF1; TGF-α, cells cotransfected with GFP-TGF-α and empty pCI; TGF-α+RHBDF1, cells cotransfected with GFP-TGF-α and pCI/RHBDF1; pCI, cells transfected with empty vector. Data are from 2 independent experiments. *P < 0.01, Student’s t test.

