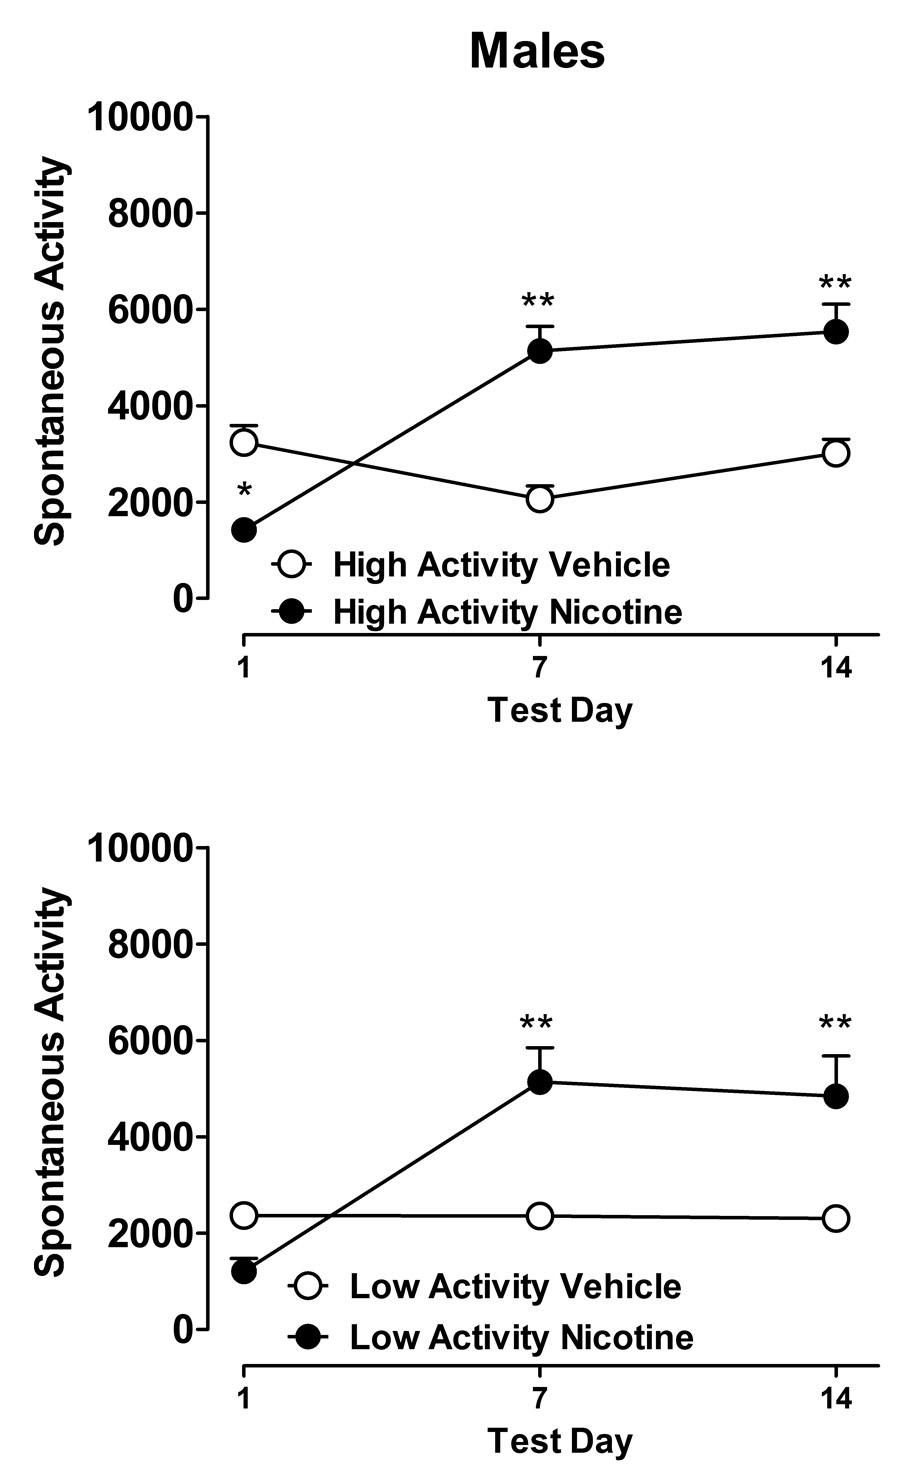
Figure 1.
Locomotor activity per 20 min test session during two weeks of nicotine (0.4 mg/kg twice daily, sc; filled symbols) or vehicle (saline, open symbols) administration in male LEW rats. Rats were further divided into high activity (HA) and low activity (LA) groups based upon their baseline level of activity prior to drug or vehicle administration. Symbols represent mean cumulative number of photobeam crosses (+/−SEM) for each test session for n=7–8 per group. *P < 0.05 and ** P < 0.01 for comparisons between nicotine- and vehicle-treated groups at each time point by Newman-Keuls test.

