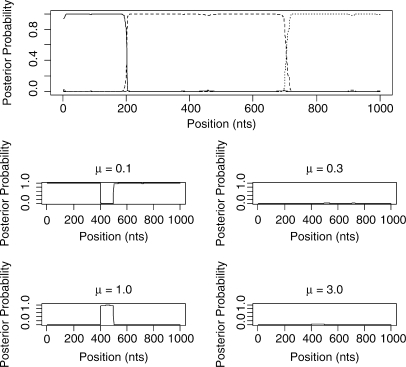
Fig. 6.
Results from the 6-taxa data simulated using the SeqGen program of Rambaut and Grassly (1997). The solid line corresponds to topology 1, the dashed line to topology 2 and the dotted line to topology 3. We have successfully recovered the recombination events. The bottom plots show the posterior probability for the different states in the rate HMM as described in Figure 5. We have inferred a change in rate between sites 400 and 500.

