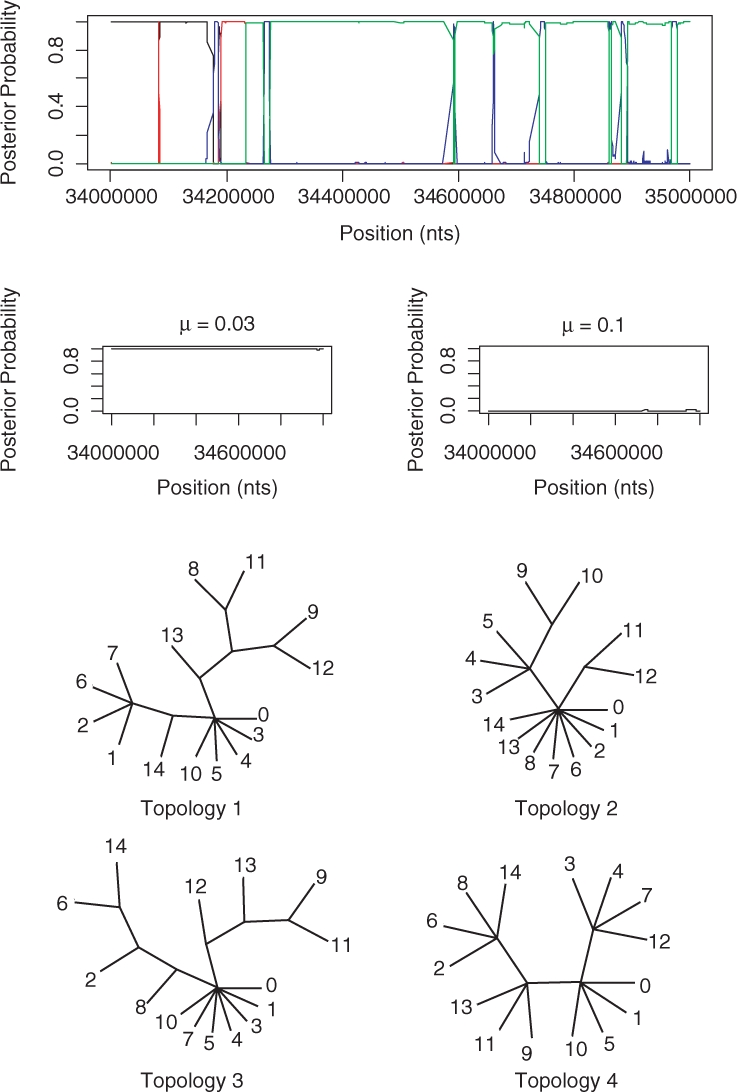
Fig. 9.

Results from the 15 inbred mouse strains. The trees output by the STHMM have been collected together into trees with multifurcations. The lines correspond to the following topologies: black—1, red—2, blue—3, green—4. The labels on the trees refer to the strains: 0—DBA/2J, 1—A/J, 2—BALB/cByJ, 3—C3H/HeJ, 4—AKR/J, 5—FVB/NJ, 6—129S1/SvImJ, 7—NOD/LtJ, 8—WSB/EiJ, 9—PWD/PhJ, 10—BTBR T+ tf/J, 11—CAST/EiJ, 12—MOLF/EiJ, 13—NZW/LacJ and 14—KK/HlJ. The trees were drawn using the TreeView program of (Page, 1996).
