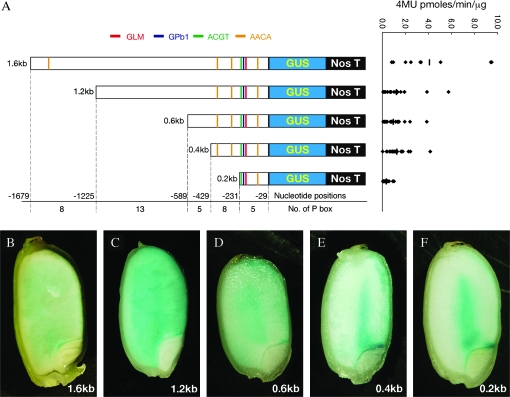
Fig. 5.
Truncation analysis of the GluD-1 promoter. (A) Schematic representation of truncated promoter:GUS constructs for generating transgenic rice (left), and expression strength (right). Promoter lengths are indicated on the left. Negative numerals indicate the nucleotide position relative to the translational start site. Putative cis-elements predicted by the PLACE database and this study, are indicated by colour bars. Red, blue, green, and orange bars represent GCN4-like motif (GLM), Prolamin box (P box) Pb1, ACGT, and AACA motifs, respectively. Numbers of P box within truncated regions are indicated. Promoter activities at 17 DAF are expressed as 4MU pmol min−1 μg−1 protein. Diamonds represent individual transgenic lines, and bars represent mean values. (B–F) GUS expression at 7 DAF, driven by 1.6 kb, 1.2 kb, 0.6 kb, 0.4 kb, and 0.2 kb GluD-1 promoters, respectively. X-gluc staining reactions were carried out for 2 h (B), and for overnight (C–E), depending on GUS activity.

