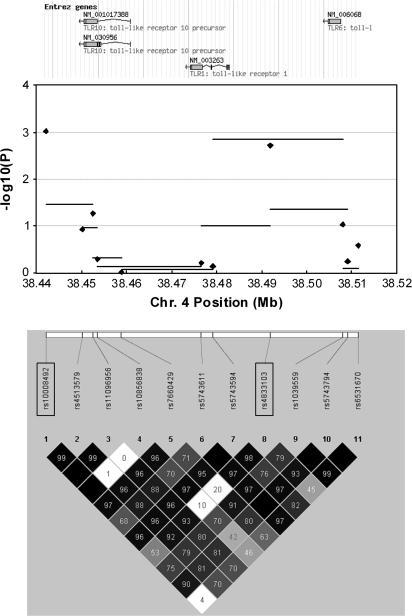
Fig. 1.
A summary of findings from analyses investigating variation in the TLR10–TLR1–TLR6 gene cluster and risk of NHL. The top of the figure illustrates the chromosomal positions of TLR10, TLR1 and TLR6. The middle portion of the figure is a plot of −log10 P-values from tests of association with risk of all NHL across the region. Horizontal bars represent the −log10 P-values from global tests of 3-SNP haplotype windows moving sequentially across the region (conducted among non-Hispanic Caucasians only). Diamonds represent the −log10 P-values from tests of trend for each individual SNP (conducted among all subjects). The bottom of the figure illustrates the chromosomal position of the 11 tag SNPs and a plot of pairwise D′ within the Caucasian (CEU) population sample of HapMap (Data Release 20/Phase II, NCBI B35 assembly, dbSNP b125). The SNPs rs10008492 and rs4833103 are enclosed in rectangles.

