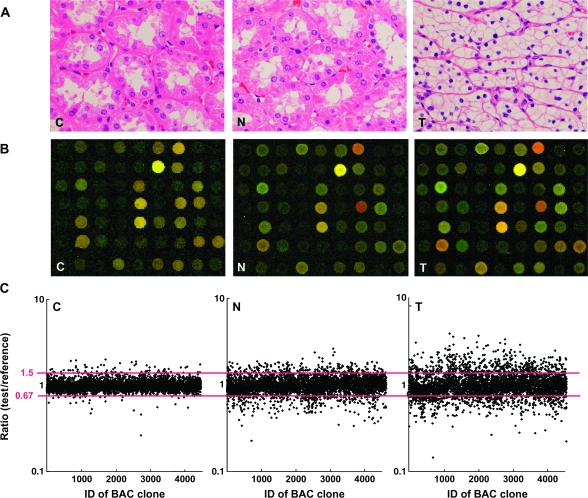
Fig. 1.
DNA methylation alterations during multistage renal carcinogenesis. (A) Microscopic view of normal renal cortex tissue obtained from a patient without any primary renal tumor (C), non-cancerous renal cortex tissue obtained from a patient with clear cell RCC (N) and clear cell RCC (T). N shows no remarkable histological changes compared with C, i.e. no cytological or structural atypia is evident in N. Since T hardly ever contains fibrous stroma between cancer cells, we were able to obtain cancer cells of high purity, avoiding contamination with stromal cells. Hematoxylin–eosin staining. Original magnification ×20. (B) Scanned array images yielded by BAMCA in C, N and T. Test and reference DNA labeled with Cy3 and Cy5 was cohybridized, respectively. (C) Scattergrams of the signal ratios (test signal:reference signal) yielded by BAMCA in C, N and T. In all eight C samples (C1–C8), the signal ratios of 97% of BAC clones were between 0.67 and 1.5 (red bars). Therefore, in N and T, DNA methylation status corresponding to a signal ratio of <0.67 and >1.5 was defined as DNA hypomethylation and DNA hypermethylation on each BAC clone compared with C, respectively. Even though N did not show any remarkable histological changes compared with C [panels C and N in (A)], many BAC clones showed DNA hypomethylation or hypermethylation. In T, more BAC clones showed DNA hypomethylation or hypermethylation, and the degree of DNA hypomethylation and hypermethylation, i.e. deviation of the signal ratio from 0.67 or 1.5, was increased in comparison with N.

