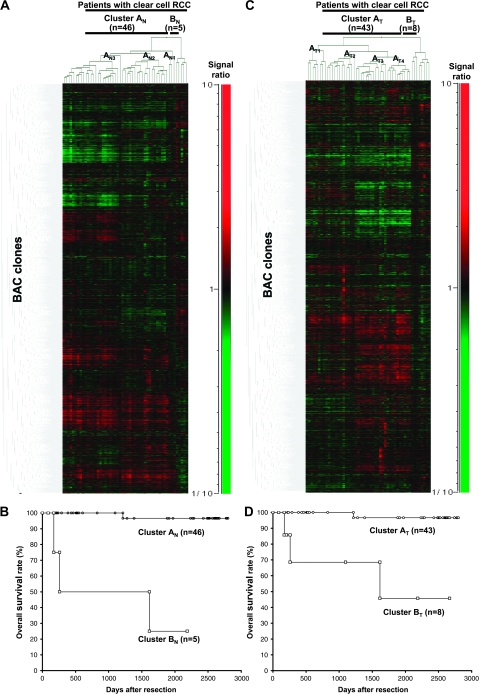
Fig. 2.
Two-dimensional unsupervised hierarchical clustering analysis based on BAMCA data (signal ratios) in non-cancerous renal cortex tissue samples showing no remarkable histological changes (A) and clear cell RCCs (C) and Kaplan–Meier survival curves of patients with clear cell RCCs (B and D). (A) Fifty-one patients with clear cell RCC were hierarchically clustered into two subclasses, Clusters AN (n = 46) and BN (n = 5), based on DNA methylation status of their non-cancerous renal cortex tissue samples. DNA hypomethylation, normomethylation (DNA methylation status corresponding to a signal ratio of between 0.67 and 1.5) and hypermethylation on each BAC clone are shown in green, black and red, respectively. The signal ratio is shown in the color range maps. The cluster trees for patients and BAC clones are shown at the top and left of the panel, respectively. (B) The overall survival rate of patients in Cluster BN (square) defined on the basis of DNA methylation status in their non-cancerous renal cortex tissue samples was significantly lower than that of patients in Cluster AN (circle) (P = 0.0000000613, Log-rank test). (C) Fifty-one patients were hierarchically clustered into two subclasses, Clusters AT (n = 43) and BT (n = 8), based on the DNA methylation status of their clear cell RCCs. (D) The overall survival rate of patients in Cluster BT (square) defined on the basis of DNA methylation status in their clear cell RCCs was significantly lower than that of patients in Cluster AT (circle) (P = 0.0000413, Log-rank test).

