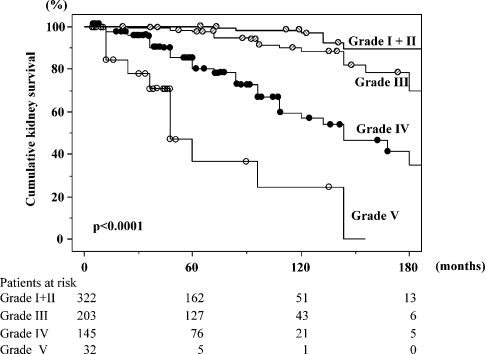
Fig. 1.
Kidney survival curve in each histological grade. The patients with histological grades I and II were analysed together due to the small number of end-stage renal failure incidence. Kidney survivals significantly differed among the histological grades (P < 0.0001). The numbers of patients remaining at 60, 120 and 180 months of follow-up in each histological grade are shown at the bottom.

