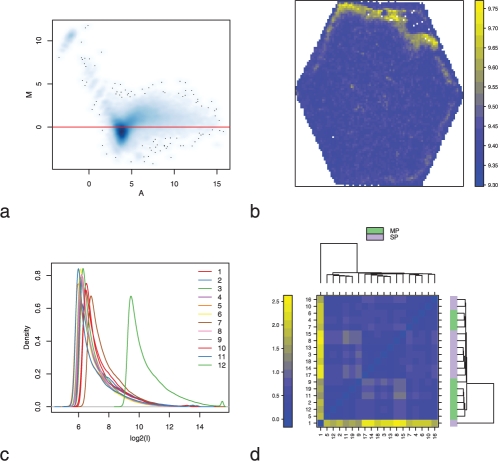
Fig. 1.
(a) MA-plot for an Agilent microarray. The M-values are not centered on zero meaning that there is a dependency between the intensities and the log-ratio. (b) Spatial distribution of the background of the green channel for an Illumina chip. There is an abnormal distribution of high intensities at the top border of the array. (c) Density plot of the log-intensities of an Affymetrix set of arrays (E-GEOD-349 ArrayExpress set). The density of one of the arrays is shifted on the x-axis. (d) Heatmap of the ArrayExpress Affymetrix data set E-GEOD-1571. Array 18 is an outlier.

