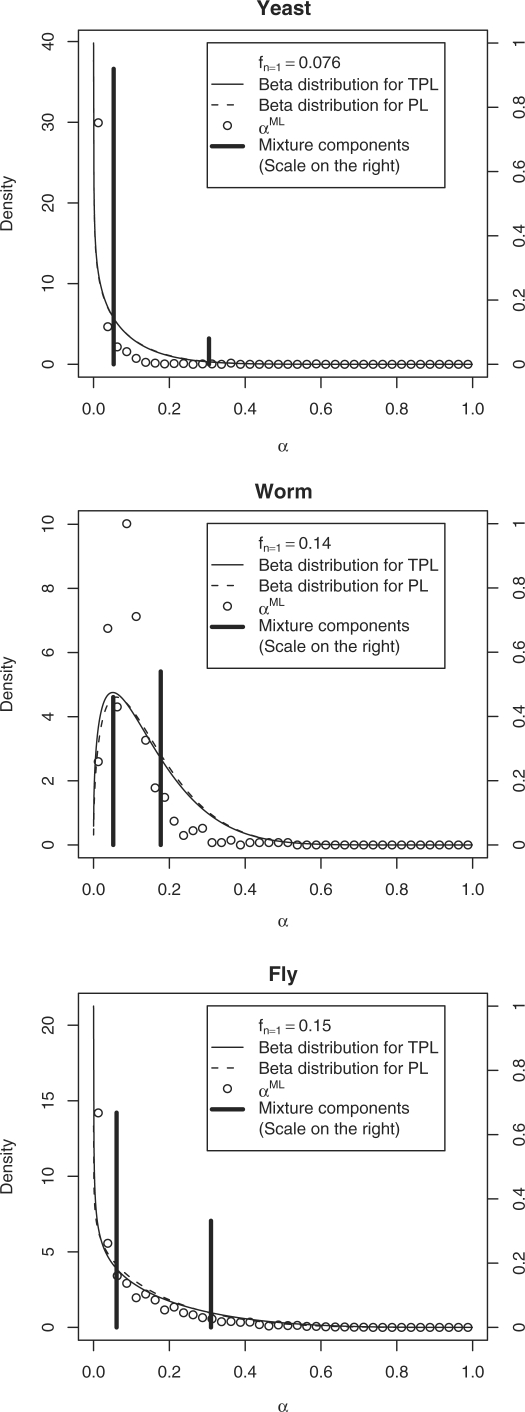
Fig. 1.
The distributions of FDRs for baits are displayed for Beta/TPL (solid line), Beta/PL (dashed line) and Mixture/TPL (black impulses) for yeast (A), worm (B) and fly (C). Posterior maximum likelihood estimates are displayed for the Beta/TPL model (open circles). Baits with a single clone do not contribute to the estimator and are not included in the histograms.

