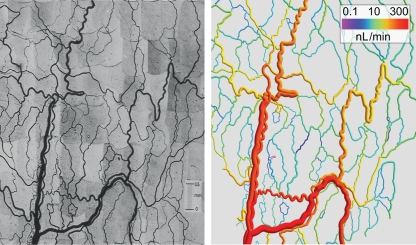
Figure 3.
Photomontage (left) and computer reconstruction (right) of a mesenteric microvascular network. The network was recorded in about 300 microscopic fields of view. The spatial arrangement of the network was obtained using custom-made digital image analysis software and is shown in a computer rendering with each segment colour-coded for blood flow rate. In this representation, vessel diameters are increased by a factor of 1.5 to allow a better judgement of the colour for small vessels.

