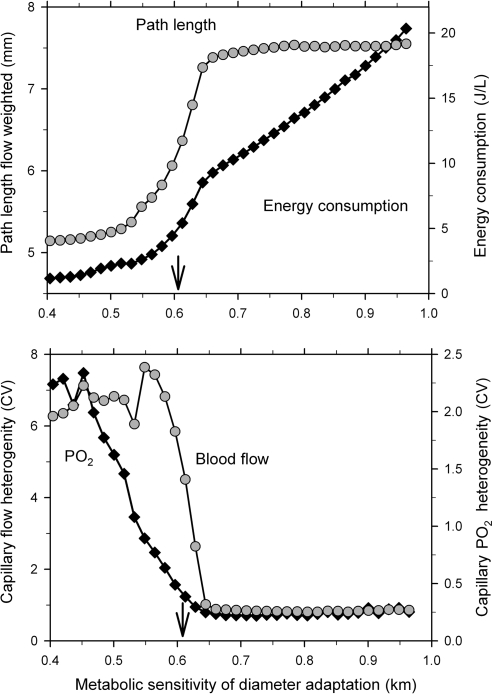
Figure 6.
For one of the mesentery networks used for Figure 5 (Meso I), values of the flow-weighted mean pathway length, the overall energy consumption (top), and the heterogeneities of flow (CVflow) and PO2 (CVPO2) on the capillary level (bottom) are shown for varying km. The threshold value for vascular sensitivity to metabolic stimuli below which oxygen deficit starts to develop is indicated by arrows.

