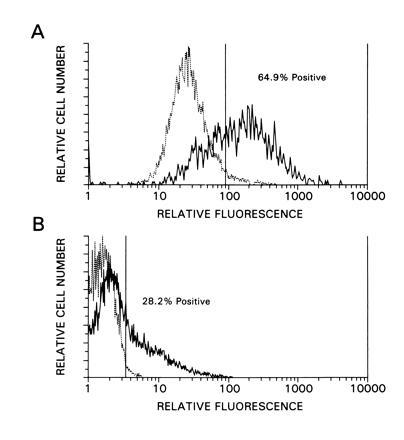
Figure 2.

Infection efficiency of HIV-HSA. (A) HOS cells were infected and tested for the expression of the HSA reporter gene by FACS analysis 96 hr after infection. The broken line represents uninfected cells, whereas the thick line corresponds to infected cells. (B) Human A3.01 cells were subjected to FACS analysis 72 hr after infection. The broken line in each panel represents uninfected cells, whereas the thick line corresponds to infected cells.
