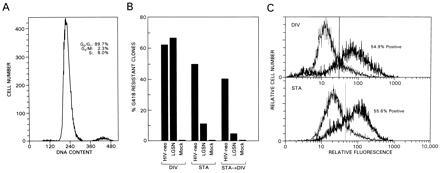
Figure 3.

Transduction of stationary and dividing primary HSF cultures. (A) Cell cycle analysis of stationary HSF cultures. The percentage of cells in a particular stage of the cell cycle is indicated. (B) Relative transduction efficiency of dividing (DIV) and stationary (STA) fibroblasts. Dividing cultures were prepared by treatment with trypsin and replating 24 hr before infection or 72 hr after infection (STA→DIV). Transduction efficiency was assessed after trypsin treatment by plating the cells into medium with and without G418 (0.35 mg/ml of active drug after 14 days) and counting the clones 2 weeks later. The percentage of G418-resistant clones reflects the number of surviving clones in DMEM/10% FBS containing G418 relative to the number of clones present in DMEM/10% FBS alone. (C) FACS analysis of dividing and stationary HSF infected with HIV-HSA. The cells were subjected to FACS analysis 4 days after infection. Thick line, infected cells; thin line, uninfected cells.
