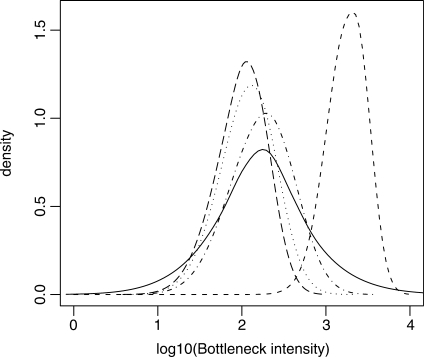
Fig. 3.
Second example: posterior distributions of the bottleneck severity (see definition in text) for the invasions of four Pacific Islands by Z.lateralis lateralis. The four discontinuous lines with small dashes, dots, dash-dots and long dashes correspond to Norfolk, Chatham, North Island and South Island of New Zealand, respectively. The continuous line corresponds to the prior distribution, which is identical for each island. This graph has been made with the locfit function of the R statistical package (Ihaka and Gentleman, 1996), using an option of DIYABC which saves the sample of the parameter values adjusted by the local linear regression (Beaumont et al., 2002).

