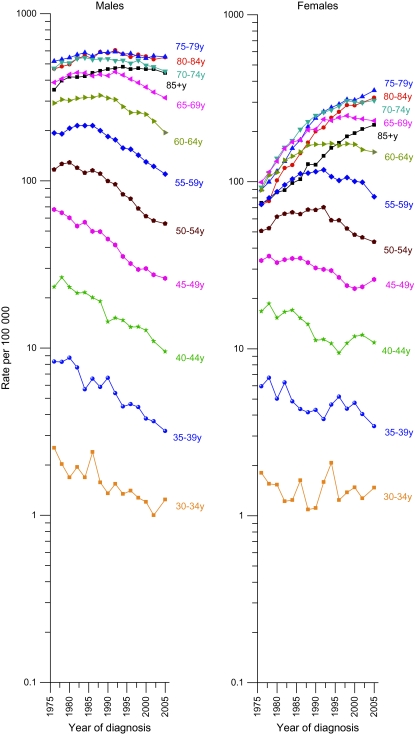
Figure 2.
Trends in age-specific lung cancer incidence rates by year of diagnosis and sex, United States, 1975–2005. Data are from Surveillance, Epidemiology, and Ends Results (SEER)-9 areas, and data points are based on 2-y average rates with the exception of the last point, which averages 3-y rates (1975–1976, 1977–1978, …, 2001–2002, 2003–2005). The SEER-9 areas cover about 10% of the US population.

