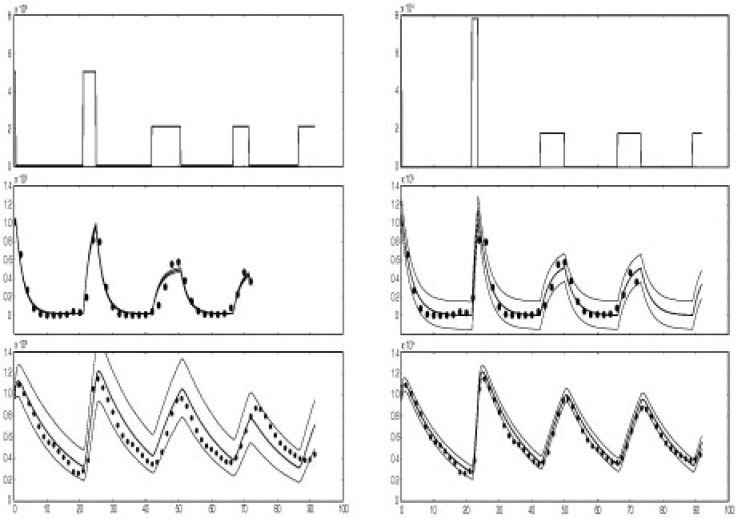
Fig. 2.
Results of fitting SDEs (left) and ODEs (right) in case study 2. Top panel shows the mean reconstructed transcription profile τ(t) using the switch approximation. Middle panel shows results for Mg. Bottom panel gives results for P. Big dots are experimental data for Mg (middle panel) and P (bottom panel). The variation is shown as follows: for SDE approach (left): solid lines in middle and bottom panel give the 5%, mean and 95% values computed from 10 000 simulations of the SDE (using mean posterior parameter estimates). For ODE approach (right): solid lines corresponds to the mean ODE fit (using mean posterior parameter estimates) plus/minus twice the mean posterior standard error.

