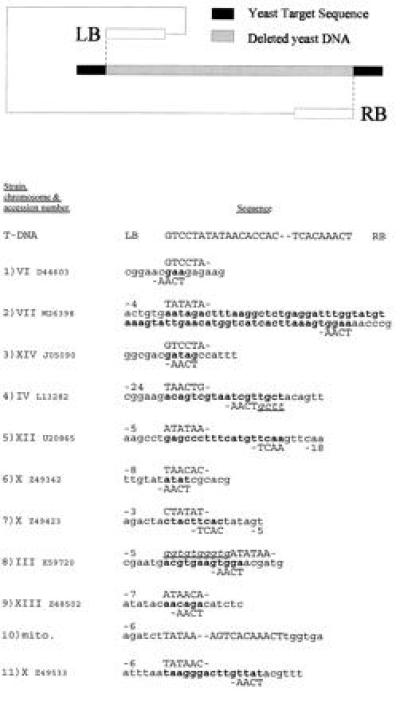
Figure 2.

Nucleotide sequences of yeast target sites and the insertion points of the T-DNA 3′ end [left border (LB)] and 5′ end [right border (RB)]. The diagram at the top of the figure presents the rationale used to present the sequence data. All the sequences are shown in the 3′ to 5′ orientation. The line marked “T-DNA” shows the termini of the processed bottom strand of the T-region that constitutes the T-DNA. This DNA is transferred to the yeast cell during cocultivations. The extent of T-DNA border truncation found in each strain after T-DNA integration can therefore be calculated by comparison of the integrated borders with the intact T-DNA. Yeast target DNA is shown in lowercase letters, and deleted yeast DNA is shown in boldface type. Filler DNA is shown in lowercase, underlined, italic type. The rescued and sequenced T-DNA borders are shown on the line above (the LB) and below (the RB) the yeast target sequence. The T-DNA borders are positioned to correspond with the left and right ends of the deleted yeast DNA. Numbers on the same line as the T-DNA border sequences indicate the number of bases lost from that T-DNA border. The T-DNA in strain 10 was fused to mitochondrial sequences, and we were therefore unable to determine the extent of the target DNA deletion.
