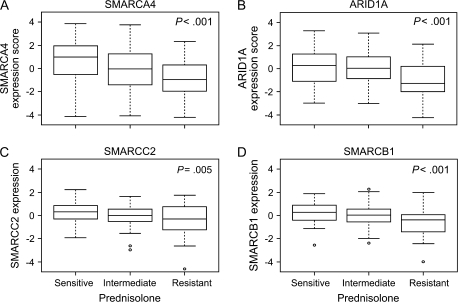
Figure 2.
Expression of genes for the subunits of the SWI/SNF complex in acute lymphoblastic leukemia (ALL) cells from 177 ALL patients and prednisolone sensitivity. A) SMARCA4. B) ARID1A. C) SMARCC2. D) SMARCB1. Pednisolone sensitivity was measured in primary leukemia cells by use of the 4-day in vitro 3-(4,5-dimethylthiazol-2-yl)-2,5-diphenyl-tetrazoliumbromide drug resistance assay. Expression score is the median mRNA level or the median mRNA expression score if multiple gene probe sets exist for the same gene. Box plots show the medians (horizontal line), interquartile ranges (box), and ranges (whiskers) of the expression level or scores, excluding outliers, for prednisolone-sensitive, intermediate, and prednisolone-resistant ALL cells. Sensitive cells were defined as having a drug concentration lethal to 50% of cells (LC50) for prednisolone of 0.1 μg/mL or less, cells with intermediate sensitivity were defined as having an LC50 of more than 0.1 μg/mL but less than 150 μg/mL, and resistant cells were defined as having an LC50 of 150 μg/mL or more (14,27–29). Among the 177 ALL patients, 58 were prednisolone sensitive, 83 were intermediate, and 36 were prednisolone resistant. P values and estimates were determined by linear regression that compared gene expression with sensitivity. Estimates were as follows: for SMARCA4, –0.71 (95% confidence interval [CI] = –1.07 to –0.34); for ARID1A, –0.56 (95% CI = –0.86 to –0.26); for SMARCC2, –0.30 (95% CI = –0.51 to –0.1); and for SMARCB1, –0.42 (95% CI = –0.62 to –0.23). All statistical tests were two-sided. Circles = outliers.

