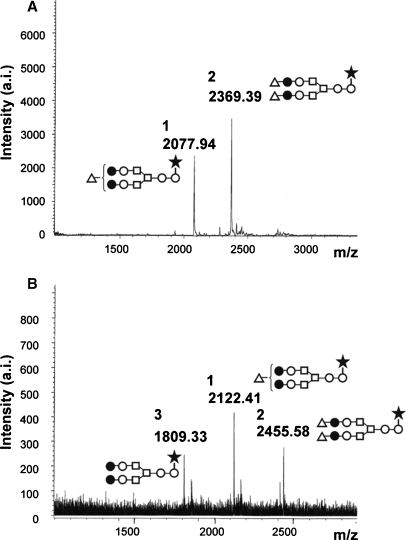
Fig. 6.
MALDI-TOF MS spectra of oligosaccharides from N162-shFcγRIIIa- His. Oligosaccharides released from N162-shFcγRIIIa-His by PNGase F digestion were analyzed using a MALDI-TOF MS spectrometer Reflex III in both a negative-ion mode (A) and a positive-ion mode (B). The m/z value corresponds to the sodium-associated oligosaccharide ion. The schematic oligosaccharide structures of each peak (1, 2, and 3) are illustrated: GlcNAc (open circles), mannose (open squares), galactose (closed circles), sialic acid (open triangles), and fucose (closed stars).

