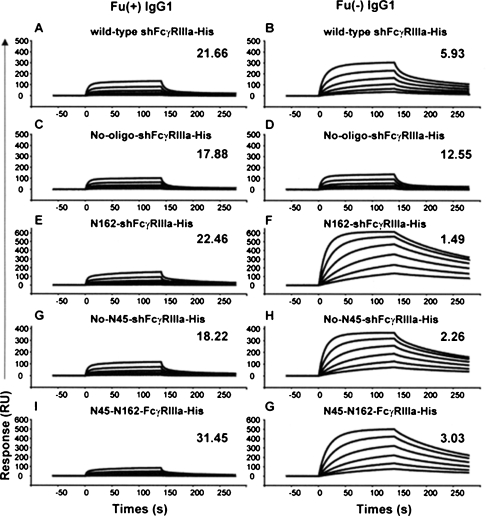
Fig. 8.
Surface plasmon resonance analysis of shFcγRIIIa-His binding to IgG1. Fucosylated (Fu(+)) and nonfucosylated (Fu(−)) anti-CD20 IgG1s were injected over shFcγRIIIa-His (the wild-type shFcγRIIIa-His (A and B), No-oligo-shFcγRIIIa-His (C and D), N162-shFcγRIIIa-His (E and F), No-N45-shFcγRIIIa-His (G and H), N45-N162-shFcγRIIIa-His (I and G)) capture sensor chip at six different concentrations (ranging from 4.17 to 133.3 nM). In a control experiment, the buffer solution without IgG1 was injected over the receptor-capture sensor chip. The sensorgram obtained from the control experiment was subtracted from the sensorgrams obtained by the IgG1 injection to yield the curves presented in the figure. The dissociation constant (KD: × 10−7 M) for the shFcγRIIIa-His calculated by steady-state analysis is shown on the right side on each sensorgram in the figure. The maximum value of the longitudinal axis was fitted to each predicted Rmax value (maximum response).

