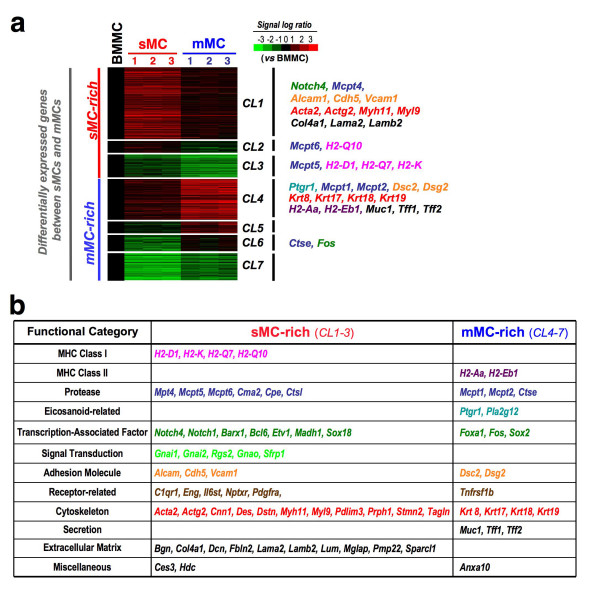
Figure 5.
Clustering analysis of the gene expression profiles between sMCs and mMCs. (a) Representation of mRNA expression levels of sMC1–3 and mMC1–3 compared with BMMCs. The color of the bars represents the ratio of signal intensity between independent samples and BMMCs, according to the scale shown on the top right. Genes with significantly different expression between sMCs and mMCs (p < 0.05, Limma's t test) were selected (1,272 genes) and classified into 7 clusters using the k-means algorithm (CL1-7). (b) Functional categorization of representative genes from (a).

