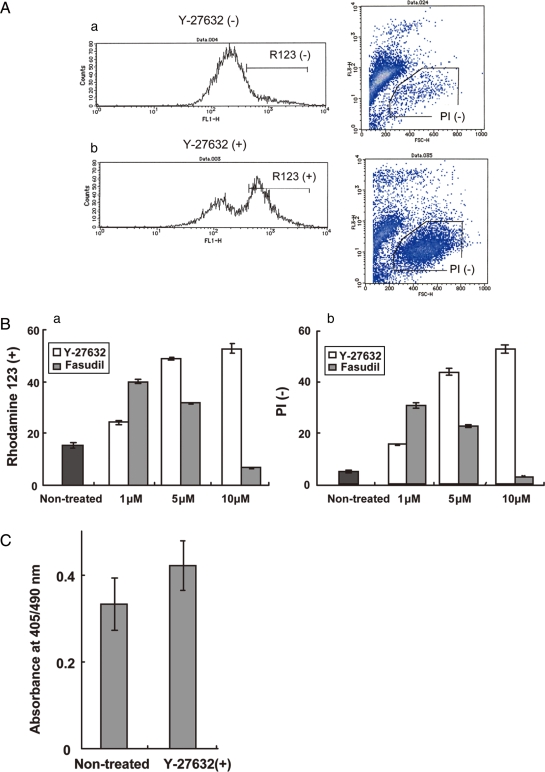
Figure 2:
Determination of the effect of ROCK inhibitors for cell surviving and proliferation.
(A) Flow cytometric observation after single-cell digestion and culture without (a) or with (b) Y-27632. Live/dead evaluations were performed using Rhodamine 123 (R123; left) and propidium iodide (PI; right). (B) Percent of live cells on the FACS-based assay using R123 (a) and PI (b). Values represented the percentage of R123 positive or PI negative cells in total cells. Significant differences were observed among all experiment groups (P < 0.01). Data represent the means ± SD of six experiments. (C) BrdU incorporation assay for attached cyES cells passaged by mechanical method. Significant difference was not observed (P < 0.05). Data represent the means ± SD of six experiments.

