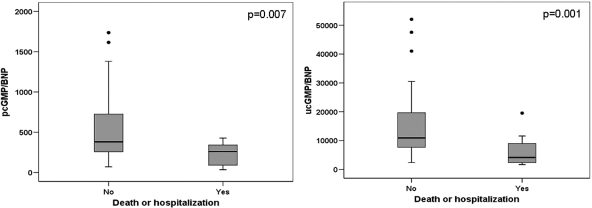
Figure 1.
Box plots of plasma cyclic guanosine monophosphate to B-type natriuretic peptide ratio (left) and urine cyclic guanosine monophosphate to plasma B-type natriuretic peptide (right) distributions in patients with and without adverse outcome events. Left panel: distribution of the plasma cyclic guanosine monophosphate to B-type natriuretic peptide ratio in patients who died or were hospitalized due to worsening heart failure during the 3-month follow-up and in patients who remained free of this outcome. The ratio was significantly lower in patients with worse prognosis (P = 0.007). Right panel: distribution of the urine cyclic guanosine monophosphate to plasma B-type natriuretic peptide ratio in patients who died or were hospitalized due to worsening heart failure during the 3-month follow-up and in patients who remained free of this outcome. The ratio was significantly lower in patients with worse prognosis (P = 0.001).

