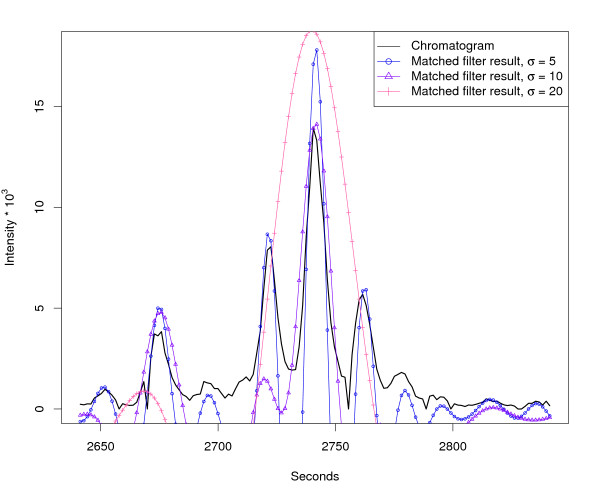
Figure 4.
Matched filter effects, example region 2. HPLC/ESI-QTOF-MS of a A. thaliana leaf extract. Extracted ion chromatogram (967.53–967.56 m/z, same sample that was used for Figure 3) and matched filter results using second derivative Gaussian with different filter widths. Negative filter values were clipped.

