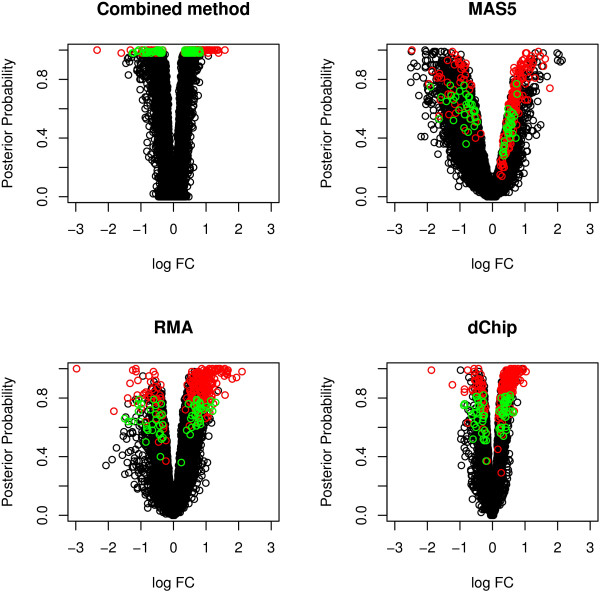
Figure 5.
Volcano plot for the HFD experiment. The plot shows the different behavior of the pre-processing methods: dChip has a small variability resulting in a compact volcano plot, while MAS5 is characterised by a large variability that causes some probesets with very different values of the log fold change to have very similar posterior probability. The combined method shows a distribution close to dChip. The 292 probesets called differentially expressed by the combined model using a cut off of 0.98 on the tail posterior probability scale are highlighted in red in all the plots; the 61 probesets selected only by the combined method are highlighted in green in all the plots.

