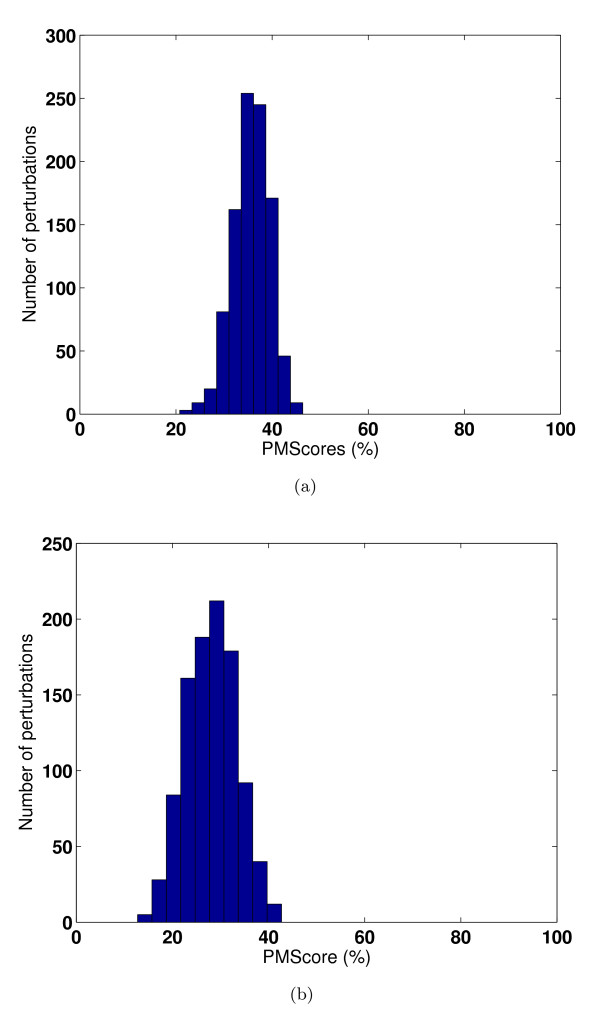
Figure 6.
Validation with respect to random perturbation of types of site-residues. Perturbation analysis for the examples shown in Figure 5(a) for a pair of high scoring sites and 5(b) for a pair of low scoring sites. Distribution of PMScores for 1000 randomly perturbed sites with respect to their original site is shown in both cases.

