
Figure 6.
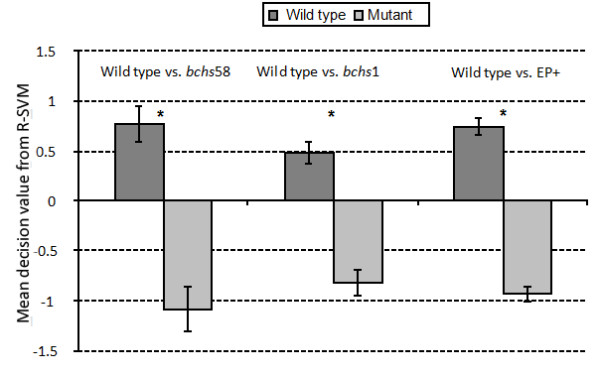
Mean decision values for R-SVM classifications of samples. Mean decision values obtained by the R-SVM on samples of wild type (dark gray) vs. bchs58, bchs1 mutant and EP+ overexpressing classes, respectively (light gray). A larger decision value indicates greater distance from the decision boundary and thus greater reliability of the classification.