
Figure 2.
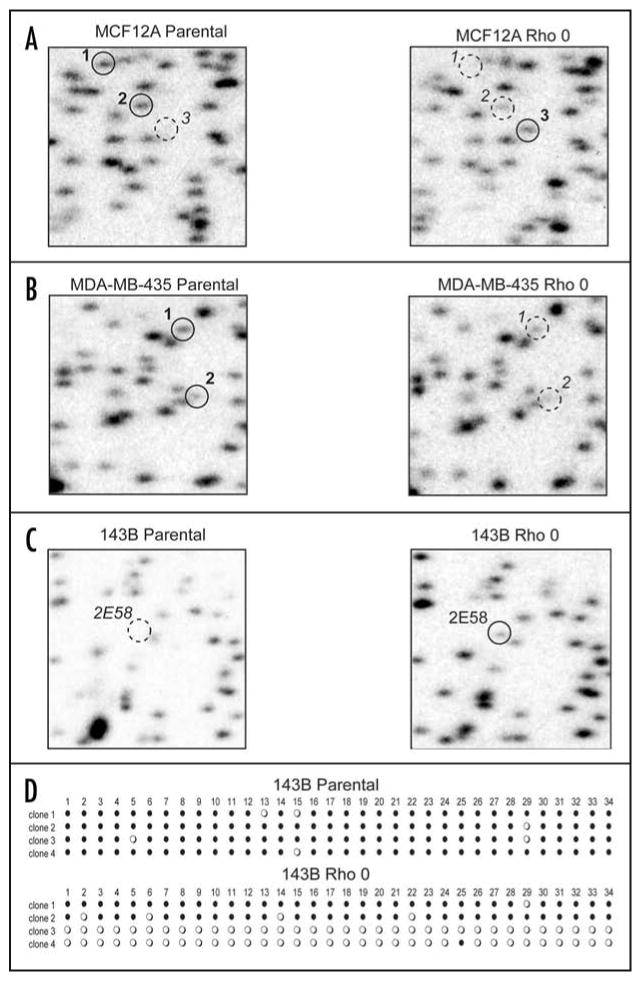
Aberrant CpG island methylation in rho0 cells. Representative examples of RLGS analysis are shown comparing three parental cell lines to their corresponding rho0 cell lines. RLGS spots of interest are shown by solid-line circles to indicate presence of the spot (lack of methylation), while dashed-line circles indicate absence of a spot (methylation). (A) MCF12A cell-line showing spots 1 and 2 exhibiting hypermethylation in the rho0 cell line and spot 3 exhibiting hypomethylation in the rho0 cell line. (B) MDA-MB-435 cell line showing spot 1 and 2 exhibiting hypermethylation in the rho0 cell line. (C) 143B cell line showing RLGS spot 2E58 exhibiting hypomethylation in the rho0 cell line. (D) Bisulfite-sequencing of 2E58 from both the 143B parental and rho0 cell lines. Four clones each were sequenced across a 285 bp region containing 34 CpG dinucleotides. Each horizontal line of circles represents the sequencing data from an individual clone. Each circle represents one CpG: closed circle = methylation; open circle = no methylation.