
Figure 2.
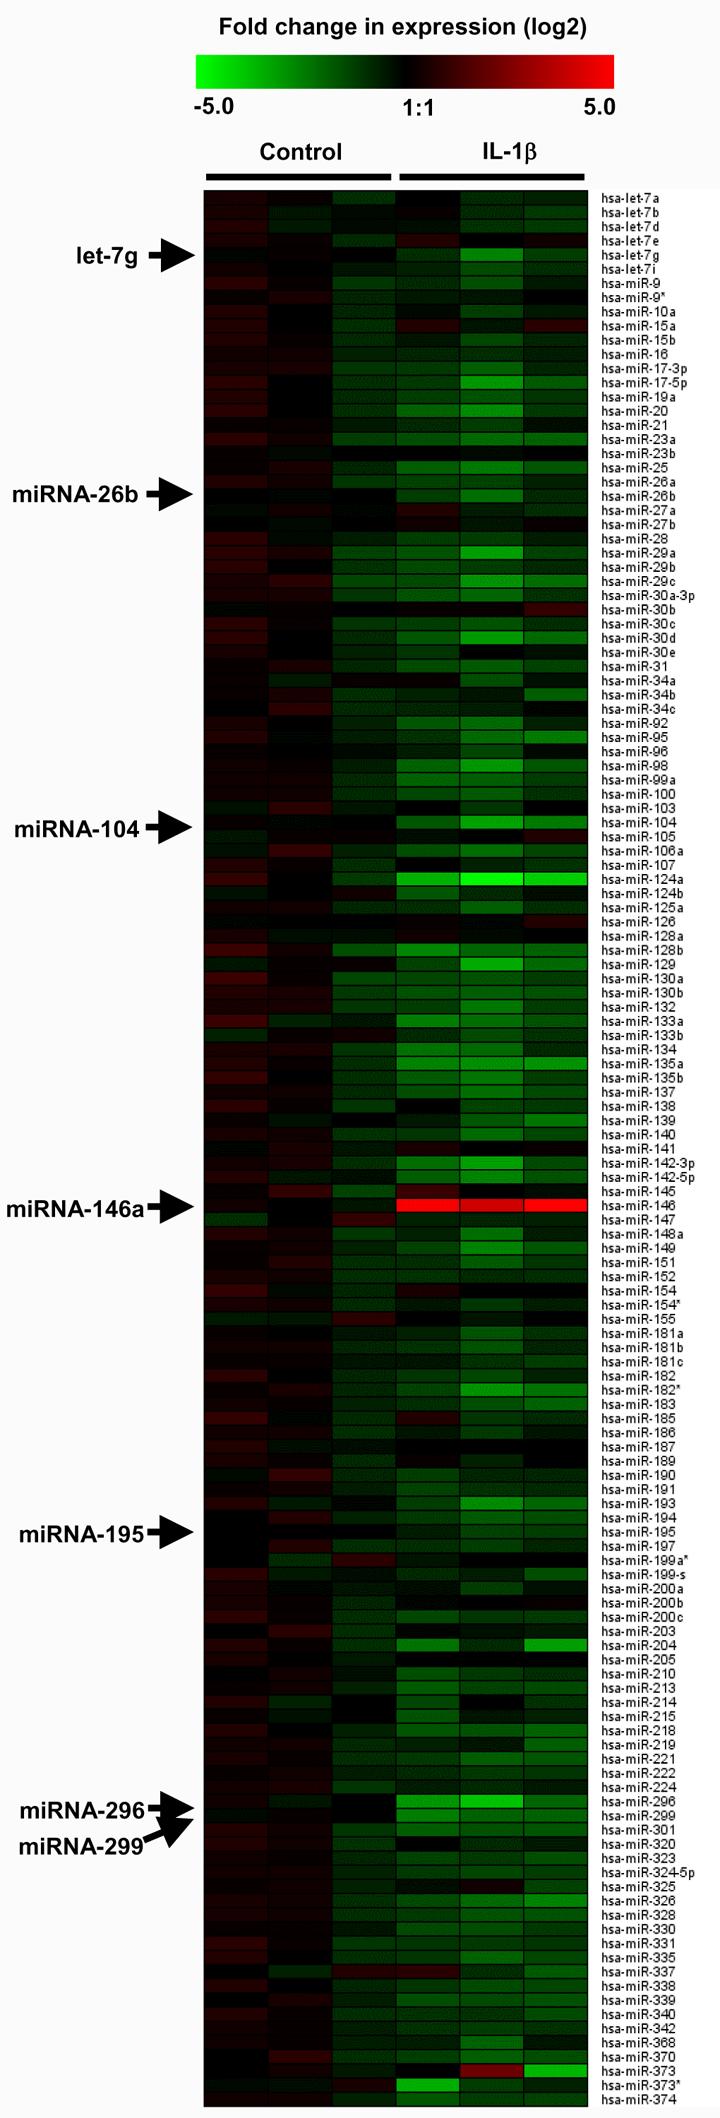
IL-1β-induced changes in miRNA expression. A549 cells were exposed to IL-1β (1 ng/ml) for 3 h and the profile of expression of 156 miRNAs was measured using TaqMan RT-PCR. The log2 transformed values of the fold-change in expression compared to time-matched saline controls are represented as a heat map where red and green indicate an increase and decrease in miRNA expression, respectively.