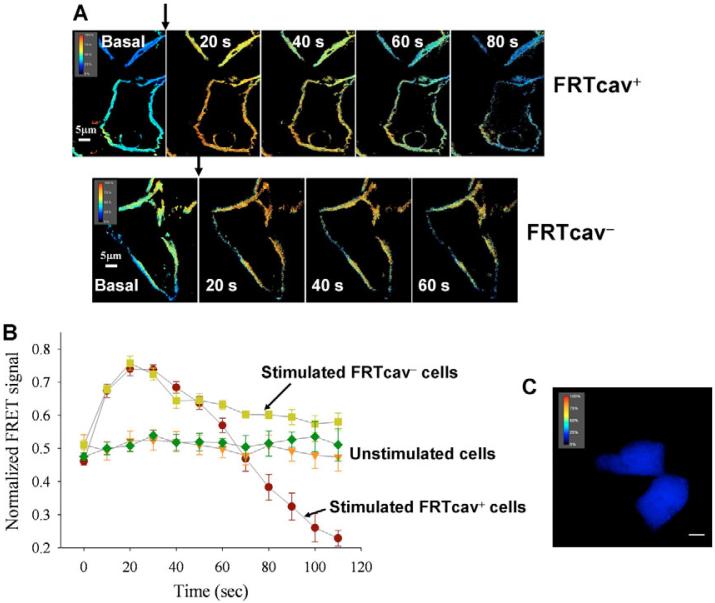
Fig. 2.
Gβγ and Gαq subunits dissociate upon carbachol stimulation in the presence of Cav1. (A) Pseudo-colored FRET images illustrating the time-dependence of energy transfer from eCFP-Gβγ to Gαq-eYFP in acetylcholine (5 μM)-stimulated FRTcav+ (upper panel) and FRTcav- (lower panel) cells. The FRET color-scale is shown for comparison (red, 100%; black, 0%). For both series, the first panel was recorded before stimulation and the elapsed time between each image is 20 seconds. (B) Compiled results of the changes in NFRET from eCFP-Gβγ to Gαq-eYFP in unstimulated and acetylcholine (5 μM)-stimulated FRTcav+ and FRTcav- cells with time. Studies were done using nine (FRTcav-) and four (FRTcav+) independent sets of samples (each measured in triplicate and averaged). (C) Pseudo-colored NFRET image illustrating energy transfer between free eCFP and eYFP.

