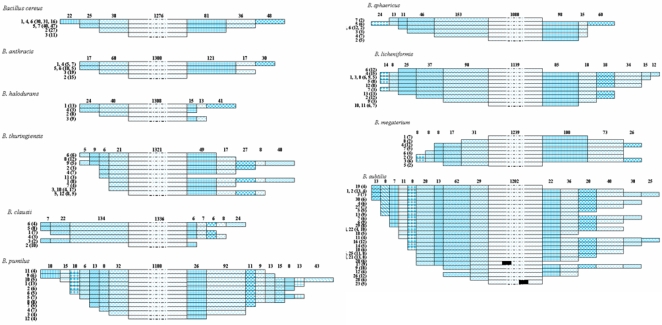
Figure 1. Variability in the terminal regions of the 16S rRNA gene sequences of Bacillus spp.:
(a). B. cereus; (b). B. anthracis; (c). B. halodurans; (d). B. thuringiensis; (e). B. clausii; (f). B. pumilus; (g). B. sphaericus; (h). B. licheniformis; (i). B. megaterium; (j). B. subtilis. Values represent group number within a species. Values within parentheses represent number of strains within the same group showing ≥95% similarity among them. Values on the top of horizontal bar represent the number of nucleotides showing similarity among groups. Dotted region in the middle is not to scale. Colored pattern corresponds to distinct fragments. Solid black box represents gap with in the sequences in B. subtilis.

