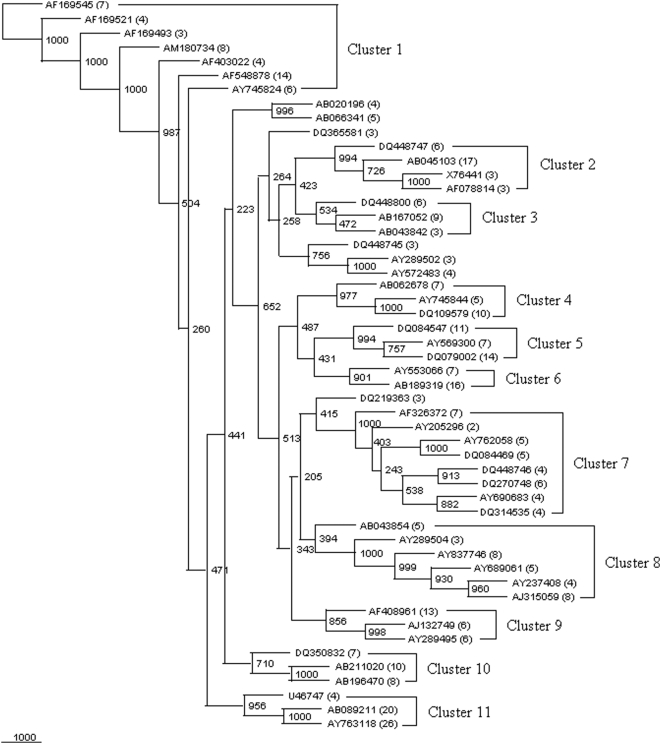
Figure 8. Phylogenetic tree of 52 representative sequences (appeared as 52 clusters {equivalent to 366 sequences} in Figures S11, S12, S13, S14, S15, S16, S17, S18, S19, S20, S21, S22, S23, S24, S25, S26, S27, S28, S29, S30, S31 to S32).
These 52 representative sequences were observed to segregate in 11 clusters: cluster 1 to cluster 11. A neighbor-joining analysis with Jukes-Cantor correction and bootstrap support was performed on the gene sequences. Bootstrap values are given at nodes, 1000 bootstrap replicates were run. Accession numbers of the representative sequences are given and values in parentheses against these are equal to the number of sequences in that group within each cluster (http://rdp.cme.msu.edu/).

