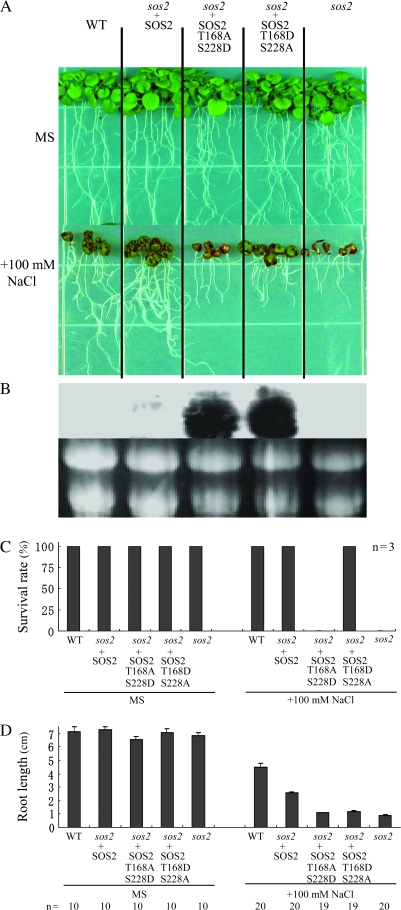
Figure 5.
Salt Tolerance Assay of sos2-2 Plants Expressing SOS2 T168A S228D or T168D S228A.
(A) Three-day-old seedlings of wild-type (WT), sos2-2 transgenic plants expressing wild-type SOS2, SOS2 T168A S228D, or SOS2 T168D S228A and sos2-2 plants grown on MS plates were transferred to MS plates with or without 100 mM NaCl. Photographs were taken 14 d after transfer. The best growing line for each construct is shown.
(B) SOS2 transcript levels are shown in RNA gel blot analysis performed with total RNA extracted 12 h after transfer to MS plates with 100 mM NaCl. Ethidium bromide stained rRNA is shown as a loading control. Lanes are labeled in (A).
(C) Survival rates of the seedlings on MS plates with or without 100 mM NaCl. Mean ± S.E. of three experiments are shown. At least 10 plants were analyzed in each experiment.
(D) Lengths of primary roots of seedlings 14 d after transfer to MS plates with or without 100 mM NaCl (mean ± S.E.; n, the number of plants measured).

