Figure 4.
HOS3 Expression Analysis and Confirmation of the hos3-2 Phenotypes.
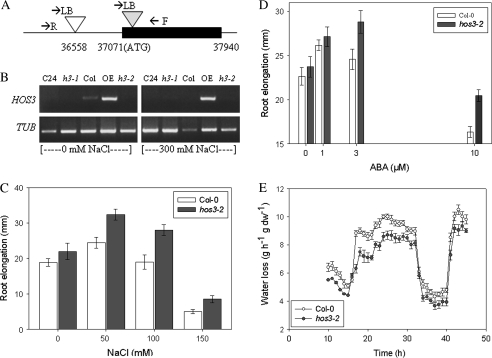
(A) Physical map of T-DNA insertion in the hos3-1 (open) and hos3-2 (shaded) mutant alleles (Accession #At4g36830).
(B) Expression of HOS3 was determined by RT–PCR using HOS3 gene-specific primers and 1 μg total RNA from C24 (RD29A:LUC) (C24), hos3-1 (h3-1), Columbia-0 (Col), Col-0 plants overexpressing HOS3 (OE), and hos3-2 (h3-2). Tubulin (TUB) was used as a loading control.
(C) hos3-2 confirms HOS3 function in osmotic stress response in vitro and in constitutive regulation of stomatal aperture under well watered conditions. Root elongation of Col-0 (open bars) and hos3-2 (closed bars) transferred to media containing NaCl (0, 50, 100, or 150 mM). Means and standard errors were determined using ANOVA with a confidence interval of α = 0.05. Error bars represent ±1 SE.
(D) Root elongation of Col-0 (open bars) or hos3-2 (closed bars) transferred to media containing ABA (0, 1, 3, or 10 μM).
(E) Water loss of intact 4-week-ld hos3-2 (closed bars) seedlings was determined gravimetrically and compared with Col-0 (open bars) wild-type. Means and standard errors were determined by ANOVA with a confidence interval of α = 0.05 for n = 12. Error bars represent ±1 SE.

