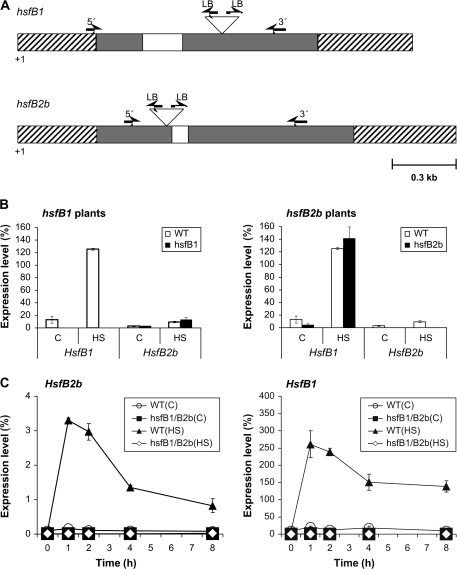
Figure 1.
mRNA Quantification of HsfB1 and HsfB2b in Single and Double Mutants.
(A) T-DNA insertion sites in hsfB1 and hsfB2b lines as determined by sequencing PCR products obtained from genomic DNA of the tagged lines using either gene-specific 5’ or 3’ primers in combination with T-DNA left border (LB) primers. Triangles indicate the T-DNA elements. Exons are depicted as grey boxes, introns as open boxes, non-translated regions as hatched boxes. The position and direction of primers for Hsf genes or T-DNA sequences are marked by horizontal arrows. T-DNA elements and primers are not drawn to scale.
Poly (A)+-RNA was isolated from leaves and analyzed by qRT–PCR for the mRNA levels of HsfB1 and HsfB1b of wild-type (WT) and single mutant (hsfB1 and hsfB2b) plants that had been subjected to heat stress (37°C, 1 h) or control temperature (22°C, 1 h) (B), or double knockout (hsfB1/B2b) plants that had been subjected to heat stress (37°C) or control temperature (22°C) for 0–8 h (C).
PCR levels were normalized with respect to Actin2 mRNA (= 100%). Data points show means (n = 2) and range (B), and means (n = 3) and S.D. (C), respectively.

