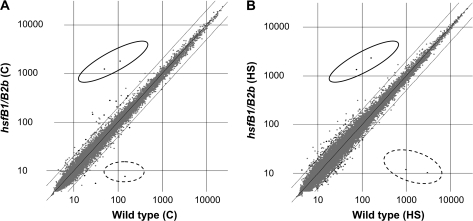
Figure 3.
Comparison of Expression Characteristics Wild-Type versus hsfB1/B2b Double Mutant Plants.
Expression levels (relative units) of all genes (gray spots) detected by microarray hybridization; black spots indicate genes differentially expressed by the following criteria: more than two-fold difference, confidence 95%, multiple testing correction Benjamini and Hochberg. The data points for Pdf1.2a and Pdf1.2b are marked with a full circle; dashed circles mark the expression levels genes (HsfB1 and HsfB2b) significantly down-regulated mutant plants.
(A) Control condition (room temperature: 22°C) comparison of wild-type (WT) and hsfB1/B2b double mutant.
(B) Heat shock (37°C) comparison of WT and hsfB1/B2b double mutant.

