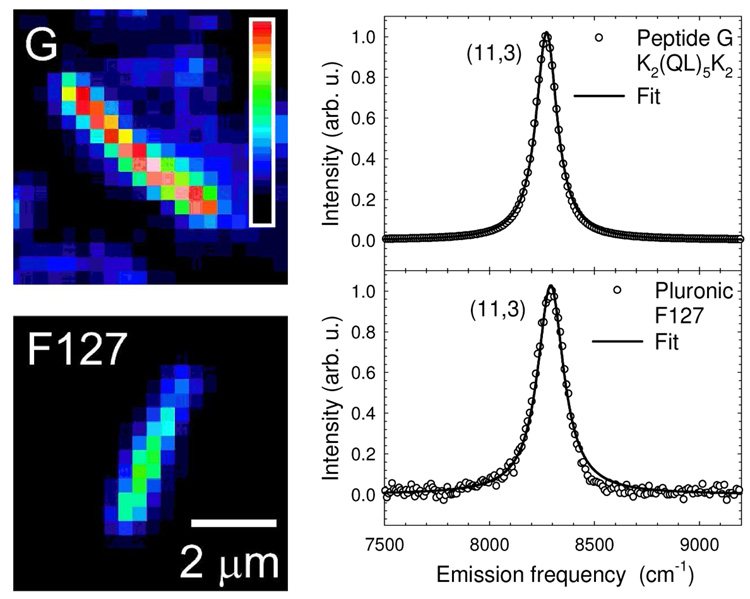
Figure 5.
Comparison of emission intensities and spectra of SWCNTs in different surfactants. Near-IR fluorescence images of individual (11,3) nanotubes suspended in peptide G (top) and Pluronic F127 (bottom) recorded under the same experimental conditions and plotted using the same false-color intensity scale. Their normalized emission spectra are also shown, with Voigt fits drawn through the data points. The deconvoluted Lorentzian widths are 106 cm−1 in G and 138 cm−1 in F127.

