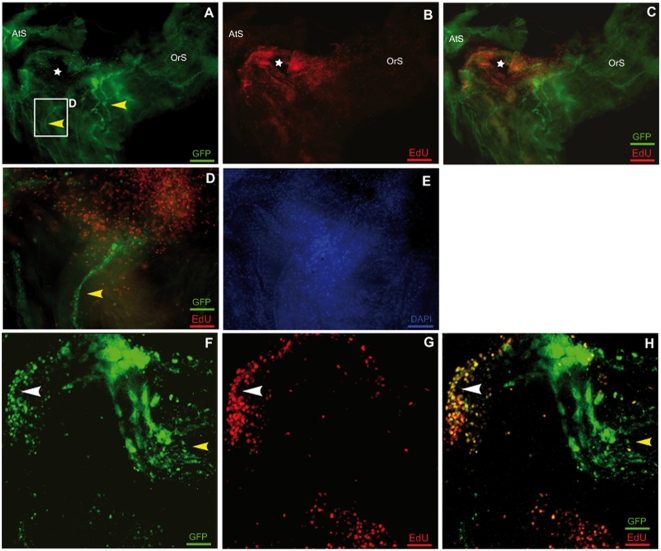
Figure 7. A blastema formation is indicated by the zones of proliferation bordering the regenerating nerves.
A–C Whole-mount preparation of an E15 transgenic animal (5×, apotome) at 4 dpa. Staining for GFP staining is shown in green and corresponds to the nerves (yellow arrowheads) with EdU staining visualized in red. A and B, merged in C. The ablation area is indicated with a white star. D, E High magnification of a nerve ending (20×, apotome). The merged image panel in D shows a zone of dense proliferation in the continuation of the nerve. DAPI staining in E, showing that the proliferative and the non proliferative zones have similar cell densities. F–H High magnification of a nerve ending (63×, projection of a stack of confocal images). A proliferation zone can be seen around the nerve ending and in its continuation. In the nerve ending, a double-stained area (GFP and EdU) was observed, demonstrating the presence of a neurogenic blastema (white arrowhead).

