
Figure 3.
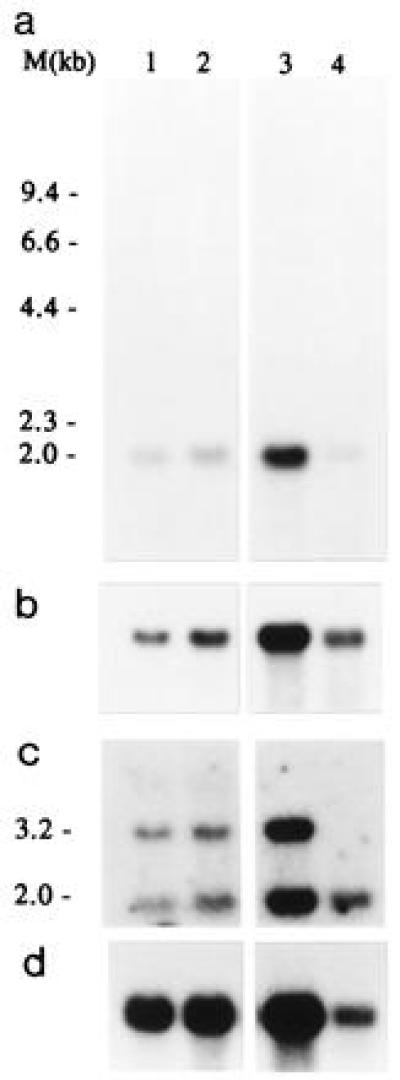
Northern blot analysis of t(X;1)-positive RCCs and normal kidney using C1-cDNA (a), TFE3-cDNA (b), or a 5′ fragment from C12 (positions 1–678) (c) as a probe. Lanes 1 and 2 contain total RNA from CL89-17872 and CL89-12117, respectively, lane 3 and 4 contain oligo(dT)-selected RNA from CL89-12117 (1.5 μg) and normal kidney tissue (cortex and medulla; 0.8 μg), respectively. An actin control hybridization is shown (d). As a molecular size marker glyoxylated λ HindIII DNA was used.