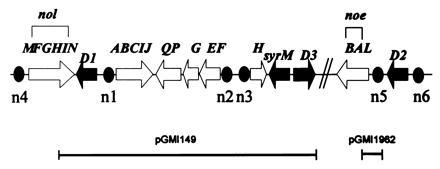
Figure 1.

Genetic map of the R. meliloti nodulation region. The open arrows represent the structural nod, nol, and noe genes and operons, and black arrows represent the regulatory nodD and syrM genes. Filled ovals identify the nod boxes. Below the map, the two segments represent the pGMI149 and pGMI1962 plasmids.
