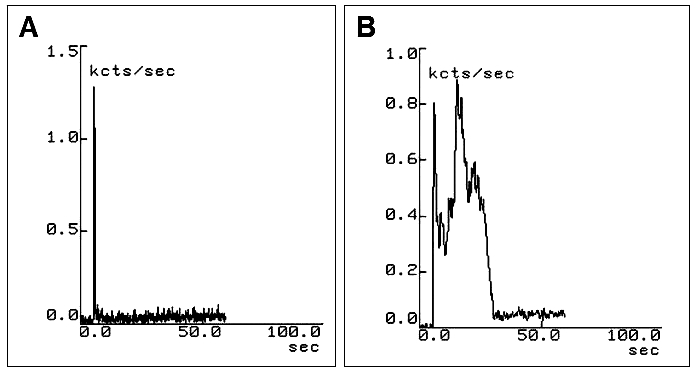
Fig. 10.

Scintigraphy of oesophageal transit performed after administration of liquid bolus (15 mL) in patient with dysphagia due to diffuse oesophageal spasm. Pharyngeal time-activity curve is within normal limits (A); oesophageal curve shows double peak of radioactivity as consequence of spasm (B).
