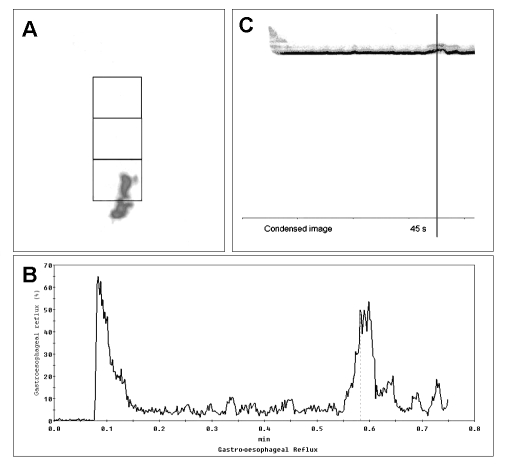
Fig. 11.
Oesophageal scintigraphy transit study (15 mL liquid bolus) of patient with gastro-oesophageal reflux. Summed image of whole oesophagus, with ROI (A). Time/activity curve shows appearance of gastro-oesophageal reflux approximately 35 sec after transit of bolus in oesophagus (B). Condensed images of oesophageal transit (C).

